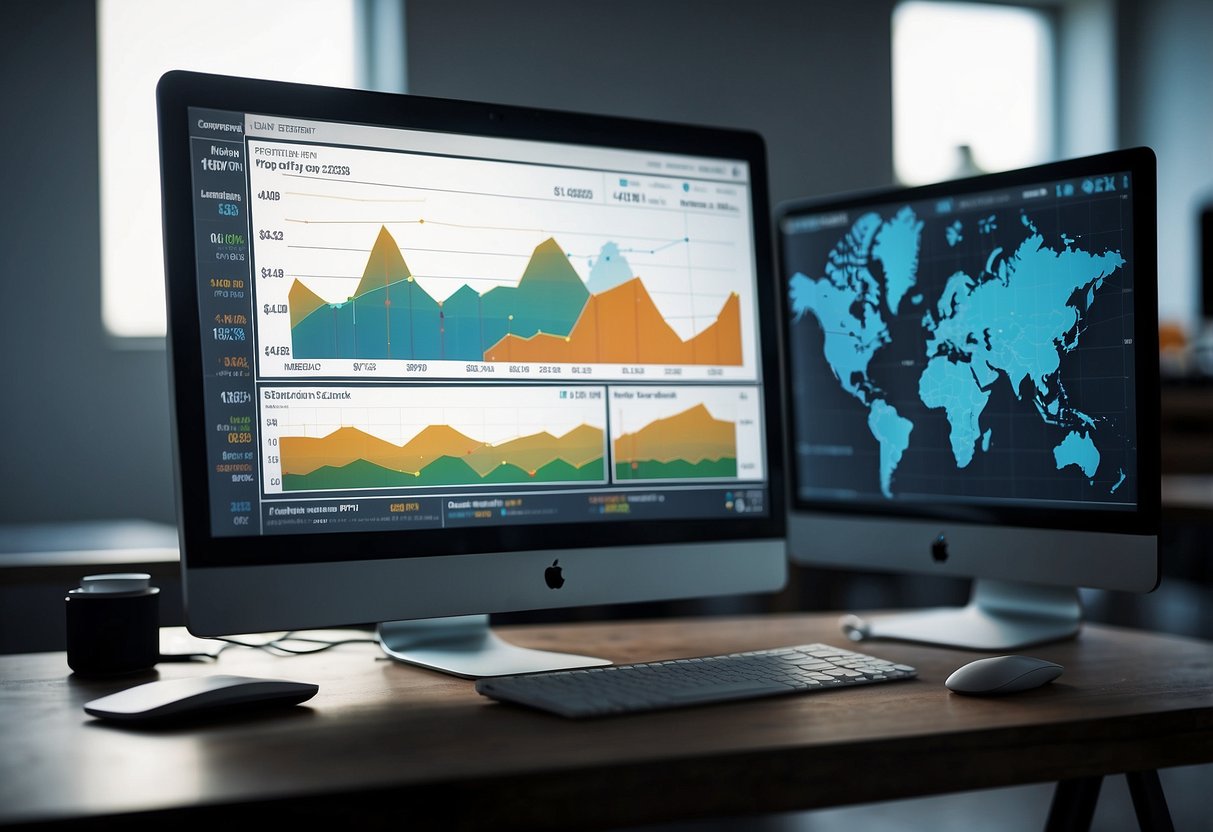
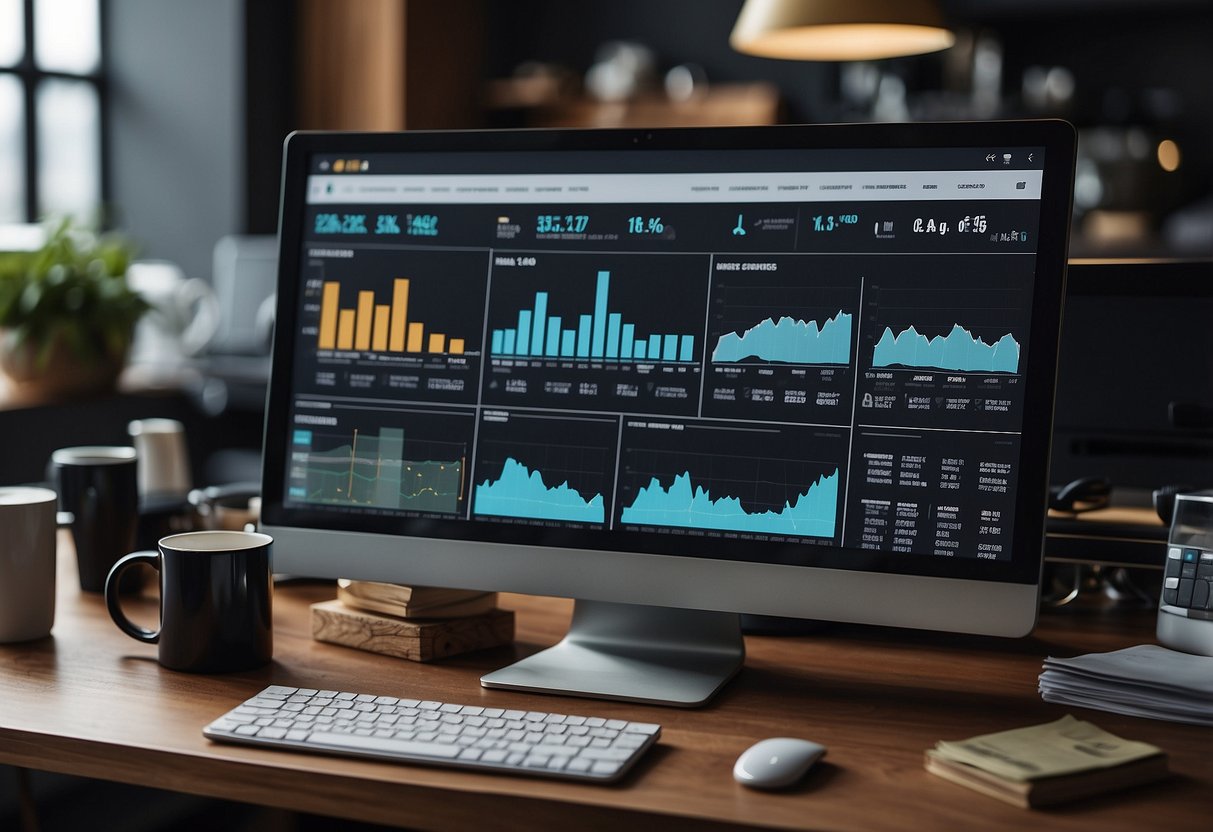
A dashboard is your one-stop solution for viewing and analyzing data in a visual format. It brings all your key metrics and data points into a single, easy-to-read interface.
Whether you’re managing a project, monitoring performance, or tracking sales, a well-designed dashboard can simplify your decision-making process.

Imagine having all your relevant information accessible at a glance. Instead of sifting through multiple reports, a dashboard consolidates your data and presents it in charts, graphs, and tables. This helps you see trends and identify issues quickly, making your job much easier.
Dashboards aren’t just for tech experts or data analysts. They are designed for anyone needing quick insights into their data. With the right tools and a bit of know-how, you can even customize your dashboard to fit your specific needs perfectly.
Key Takeaways
- Dashboards put all important data into a single view.
- They simplify monitoring and decision-making with visual elements.
- Customizable dashboards are accessible for everyone.
Understanding Dashboards
Dashboards are powerful tools used in various industries to present data and insights in a visually engaging manner. They help users track key performance indicators (KPIs) and metrics to facilitate informed decision-making.
Core Components
Every dashboard comprises a few essential elements. Metrics and KPIs form the backbone, providing measurable values that indicate performance.
Visualization tools like charts, graphs, tables, and maps help illustrate these metrics effectively.
Charts and Graphs: These graphical elements make data interpretation easier. Bar charts, pie charts, and line graphs are common examples.
Tables: Useful for displaying detailed data. They help in comparing multiple metrics side by side.
Maps: Ideal for geographical data to show regional patterns or distributions.
These components add value by simplifying data, making it easier to digest at a glance.
Common Types
There are several types of dashboards tailored for specific needs.
Sales Dashboards: Track sales performance, pipeline status, and revenue goals.
Operational Dashboards: Monitor daily operations, providing real-time data on key activities and processes.
Analytical Dashboards: Focus on deep data analysis, often used for strategic planning and forecasting.
Strategic Dashboards: Align with long-term goals and provide a broad view of progress toward organizational objectives.
Other examples include Marketing Dashboards, Financial Dashboards, Project Management Dashboards, Healthcare Dashboards, Retail Dashboards, and Customer Service Dashboards.
Each type serves a unique purpose, enabling targeted insights for various business functions.
Benefits of Dashboards
Dashboards offer numerous advantages. First, they enable real-time data monitoring, allowing you to react swiftly to changes.
You can make data-driven decisions more efficiently, which enhances improved decision-making and boosts overall organizational efficiency.
Moreover, dashboards can give you a competitive advantage by quickly identifying trends and areas needing improvement.
They also elevate the customer experience by providing insights into customer behavior and preferences.
Insights gained can lead to better strategies and outcomes across different business areas.
Designing a Dashboard

Designing a dashboard involves balancing visual appeal with data clarity. It’s crucial to focus on key design elements and follow best practices to ensure effectiveness.
Key Design Elements
Start by selecting relevant data to display. Avoid clutter by including only the most critical metrics.
Use a clean layout and limit the number of visualizations to avoid overwhelming users.
Visualization: Choose the right types, such as bar charts for comparisons or line charts for trends.
Colors and Labels: Use contrasting colors for better readability and clear, concise labels to explain data points.
Styles: Maintain a consistent style, including fonts and icons, to create a cohesive look.
Customizable Options: Offering options for users to tweak the dashboard can improve user experience, making it more personalized and practical.
Best Practices
It’s important to maintain simplicity.
Focused Content: Ensure each dashboard component serves a specific purpose. Keep it straightforward and to the point.
Interactive Data Visualizations: Allow users to interact with the data. Features like filters or drill-down options can provide deeper insights without cluttering the interface.
Context: Provide context for the data presented. Use tooltips, captions, or contextual information to make your data more meaningful.
User Testing: Gather feedback from actual users to identify and fix usability issues. Adjust the design based on how people interact with it.
Regular Updates: Keep your dashboard up to date with the latest data and make iterative improvements based on user feedback and new requirements.
Building and Tools

Building a dashboard requires the right software and platforms as well as a clear roadmap. Using the right tools can streamline the process, making it easier to monitor and analyze data efficiently.
Dashboard Software & Platforms
Choosing the perfect dashboard software is crucial. Popular options include Tableau, Google Sheets, and Excel. Each tool offers unique features:
- Tableau: Known for its interactive dashboards and robust data visualization capabilities. It integrates well with various data sources.
- Google Sheets: Great for collaboration and straightforward data manipulation. It’s perfect for teams needing real-time editing.
- Excel: Versatile and widely used. It’s excellent for complex calculations and detailed data analysis.
Business Intelligence platforms also provide comprehensive solutions for dashboards. These platforms often offer templates, making it easier to get started.
Key features to consider include customization options, ease of use, and integration capabilities.
Creating Your Dashboard
Creating a dashboard starts with identifying your key metrics. What do you need to monitor? Once identified, you can collect and organize your data.
Steps to create a dashboard:
- Choose your software: Select the tool that best suits your needs (e.g., Tableau for advanced visualization).
- Import your data: Use integrations to pull data from various sources.
- Design your layout: Organize your metrics and choose the right charts and graphs.
- Customize: Tailor the dashboard to fit your specific requirements.
Templates can be a lifesaver. They offer a pre-designed structure, allowing for quick setup.
Make sure your dashboard is interactive, enabling users to drill down into the data. This makes monitoring and analyzing trends much more effective.
Remember, simplicity is key. A cluttered dashboard can confuse users. Keep it clean and focused on the essential data points.
Integrating and Utilizing Data

In this section, we’ll explore how to bring together data from multiple sources and how to use that data for analytics and reporting to gain valuable insights.
Data Sources and Integration
To get the most out of a dashboard, you need to pull data from a variety of sources. This could include databases, raw data files, and web analytics tools.
A data pipeline is essential for integrating data. Pipelines automate the flow of data from source systems into the dashboard.
Common tools include ETL (Extract, Transform, Load) systems, which ensure that data is clean and ready for analysis.
Think of pulling data from multiple sources like gathering ingredients for a recipe. You can’t make a great dish if you only have one ingredient.
By integrating multiple data sources, you ensure a richer and more comprehensive data set. For example, sales data combined with web analytics provides deeper business insights.
Analytics and Reporting
Once your data is integrated, the next step is analytics and reporting.
Data analytics involves transforming raw data into meaningful insights.
Tools can provide real-time analytics, allowing you to make quick, data-driven decisions.
Dashboards often feature reporting tools that can generate summary reports.
Imagine being able to see sales figures, customer engagement, and operational metrics all in one place.
Reporting also allows for customization. You can tailor reports to suit different audiences. For instance, detailed reports for data analysts and simplified summaries for executives.
Analytics helps in identifying trends, predicting future outcomes, and improving performance.
Utilizing dashboards in this way turns raw data into actionable insights, empowering you to drive your business forward.
Managing Dashboard Performance

To ensure your dashboard runs smoothly, focus on setting performance indicators and goals, as well as consistently gathering feedback for improvement.
Performance Indicators and Goals
Performance Indicators and goals are essential to measure and improve your dashboard’s effectiveness.
Key Performance Indicators (KPIs) like Sales Performance, Marketing Performance, ROI, and Conversion Rate provide a clear picture of progress.
Set clear, measurable goals aligned with these KPIs. For example:
- Sales Performance: Track monthly sales against targets.
- Marketing Performance: Measure the effectiveness of campaigns through various metrics.
- ROI: Calculate the return on investment for each initiative.
- Conversion Rate: Monitor the percentage of visitors who complete desired actions.
These indicators help you identify what’s working and what needs adjustment.
Feedback and Improvement
Regular feedback is crucial for keeping your dashboard relevant and effective.
Collect feedback from users, including team members and other stakeholders, to understand their experience.
- Use surveys or direct feedback sessions to gather insights.
- Implement Augmented Analytics for advanced data analysis to predict trends.
Pay attention to constructive criticism and make necessary changes.
Continuous improvement ensures your dashboard remains a valuable tool for achieving your goals.
Case Studies and Examples

Imagine you’re managing a sales team. A Sales Dashboard can help you track key metrics like conversion rates, revenue targets, and sales performance.
Jane, a sales manager at Company X, used a sales dashboard to increase her team’s sales by 20% in three months.
Operational Dashboards are perfect for those in logistics or day-to-day operations. For instance, a logistics company used an operational dashboard to monitor delivery times, vehicle status, and fuel consumption.
This insight reduced their delivery time by 15% and saved on fuel costs.
Ever analyzed website traffic? Chances are, you’ve encountered Google Analytics, a well-known Analytical Dashboard. It helps you track visitor data, page views, and conversion rates.
A marketing firm used Google Analytics to improve their client’s website traffic by 35% in six months.
Strategic Dashboards are used by higher management for long-term goals. A CEO of a tech startup used a strategic dashboard to monitor quarterly goals, market trends, and competitor analysis.
This tool helped him make data-driven decisions, contributing to a 30% growth in a year.
Tactical Dashboards are focused on specific projects or departments. Take Lisa, an HR manager, who used a tactical dashboard to track recruitment metrics, employee performance, and training programs.
This led to a 25% increase in employee productivity.
Dashboard Maintenance and Evolution

Keeping a dashboard up-to-date isn’t just a one-time task. Think of it as a garden that needs regular care.
What needs regular updating?
- Data Sources: Ensure they remain accurate.
- Design Elements: Fresh visuals keep users interested.
- Metrics and KPIs: Adjust these as business goals shift.
Why should you care?
Using outdated data for a marketing campaign or a finance forecast is frustrating. Keeping dashboards current helps avoid these pitfalls.
Tips for Maintenance
- Routine Checks: Set a schedule for reviewing and updating your dashboard.
- Engage End-Users: Collect feedback from your team.
- Automation: Use tools that can automatically update data feeds.
Evolution Over Time
Dashboards evolve as business needs change. You may start with simple metrics like sales and marketing trends. Over time, more complex analytics for finance and management come into play.
Keeping Up with Trends
Being adaptable is key. New data sources or analytical methods might emerge, so take time to incorporate these advancements.
“The only constant in life is change.” – Heraclitus
Quick Analysis for Decision-Making
A well-maintained dashboard can save time for quick analysis. It also offers instant insights.
Imagine needing a last-minute report for management. A current dashboard makes it possible.
Maintaining and evolving your dashboard ensures its value and relevance. Don’t let it gather dust. Keep it flourishing!


